Comparison to H*Wind product
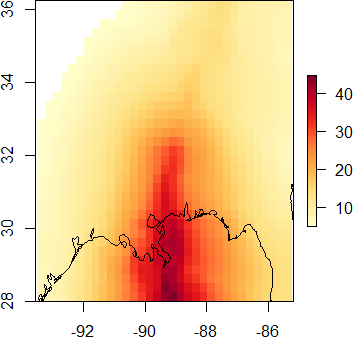
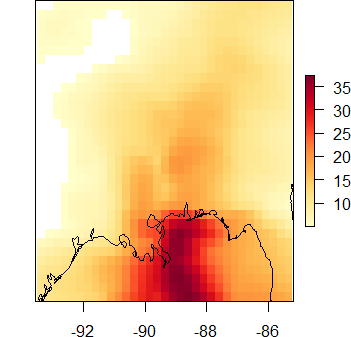
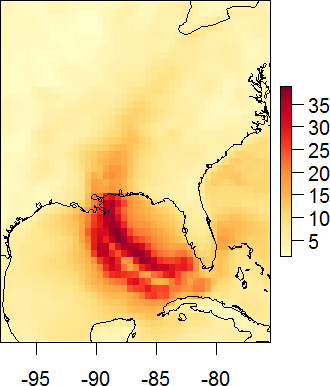
Below is the the wind swaths comparison of hurricane Katrina for Luisiana, USA: the place of the hurricane’s deployment over the land.
|
|
The spatial resolution of the both maps is 0.25° × 0.25°. The H*Wind wind speed values for a single 0.25° × 0.25° grid cell were averaged with 0.81 coefficient as they suggest.
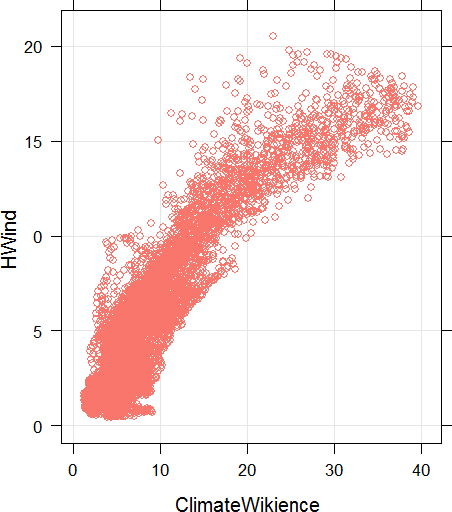
The scatterplot of the wind speed values for this region is presented below.
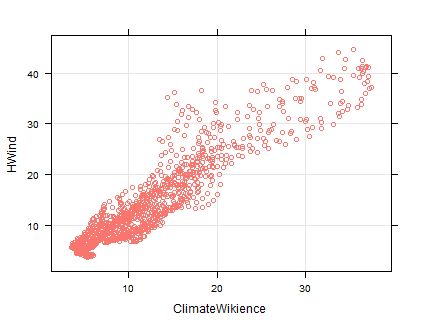
The Spearman correlation between H*Wind and Climate Wikience output for this region equals to 0.89. This correlation coefficient is generally considered to be “very strong” meaning very good agreement between the two datasets. The Spearman method was used since the data are not normally distributed.
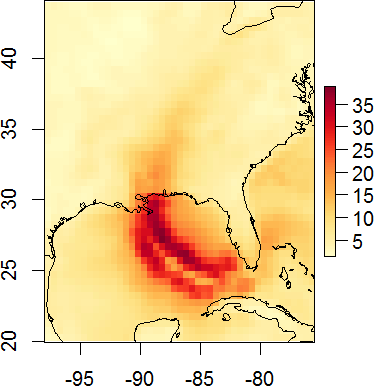
The complete swaths (for full hurricane Katrina lifetime) are shown below.
|
|
|
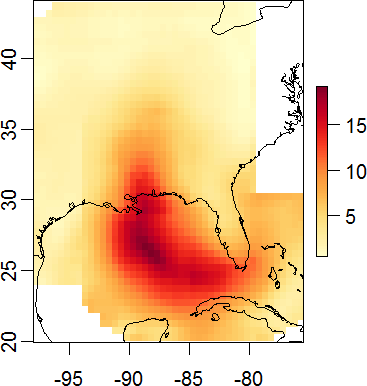
The scatterplot (Spearman correlation is 0.86):
Note: missing value = -1
> GDALinfo("hw_katrina.tif") rows 48 columns 45 bands 1 lower left origin.x -98 lower left origin.y 20 res.x 0.5 res.y 0.5 ysign -1 oblique.x 0 oblique.y 0 driver GTiff projection +proj=longlat +datum=WGS84 +no_defs file hw_katrina.tif apparent band summary: GDType hasNoDataValue NoDataValue blockSize1 blockSize2 1 Float32 TRUE -1 45 45 apparent band statistics: Bmin Bmax Bmean Bsd 1 -1 19.23882 4.505298 4.636218 Metadata: AREA_OR_POINT=Area |
(2) GDAL info: Climate Wikience Hurricane Katrina GeoTIFF Swath
Note: missing value = -1
> GDALinfo("cw_katrina.tif") rows 146 columns 135 bands 1 lower left origin.x -99 lower left origin.y 13.25 res.x 0.25 res.y 0.25 ysign -1 oblique.x 0 oblique.y 0 driver GTiff projection +proj=longlat +datum=WGS84 +no_defs file cw_katrina.tif apparent band summary: GDType hasNoDataValue NoDataValue blockSize1 blockSize2 1 Float32 TRUE -1 15 135 apparent band statistics: Bmin Bmax Bmean Bsd 1 0 39.67152 6.211201 5.257813 Metadata: AREA_OR_POINT=Area |
Useful links
- Video tutorial: how to open GeoTIFF in Quantum GIS


Archives
- February 2022 (1)
- May 2015 (1)
- April 2015 (1)
- February 2015 (8)
- January 2015 (4)
- November 2014 (5)
- October 2014 (4)
- May 2014 (4)
Tags
- Air pollution (1)
- Air pollution risk (1)
- AMSR-E (2)
- Aura Satellite (1)
- CFSR (3)
- Cloud top pressure (1)
- Cloud top temperature (1)
- Greeness fraction (1)
- Hurricane Katrina (5)
- IBTrACS (1)
- isolines (4)
- LAI (1)
- MERRA (1)
- MODIS (2)
- Nitrogen dioxide (2)
- OMI (2)
- QuikSCAT (2)
- RWikience (1)
- SSMIs (2)
- Time series (2)
- TMI (2)
- Wind speed (2)
