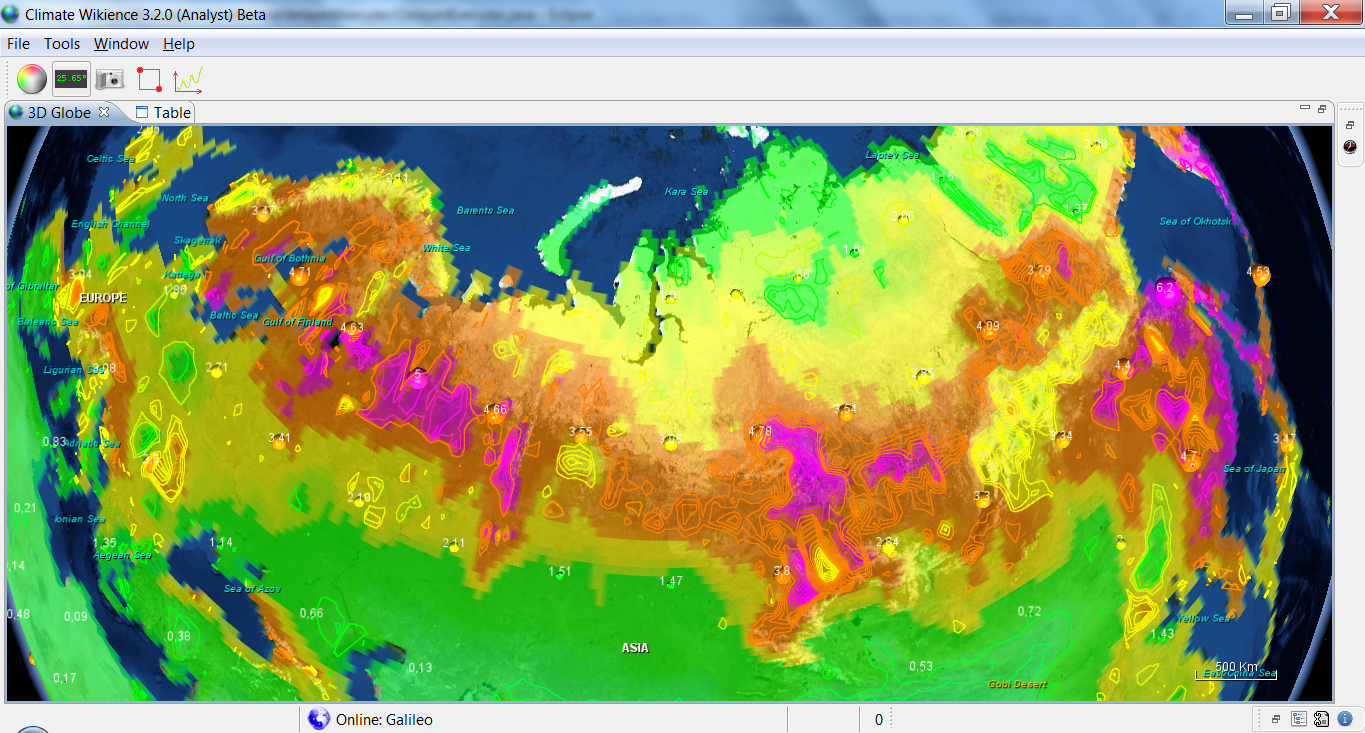
Nitrogen Dioxide (NO2): Europe air pollution
Nitrogen Dioxide — is one of the most common atmospheric pollutants. Stimulates acid rain, affects the respiratory tract and lungs, causes changes in the composition of blood, in particular, reduces the content of hemoglobin in the blood.
Climate Wikience makes possible to quickly build air pollution risk maps using satellite data with high resolution. High resolution maps of air pollution risks allow answering many important questions in the domain of ecologic safety. For example, what countries have the highest level of air pollution and what is the relative level of air pollution between different regions inside a country.
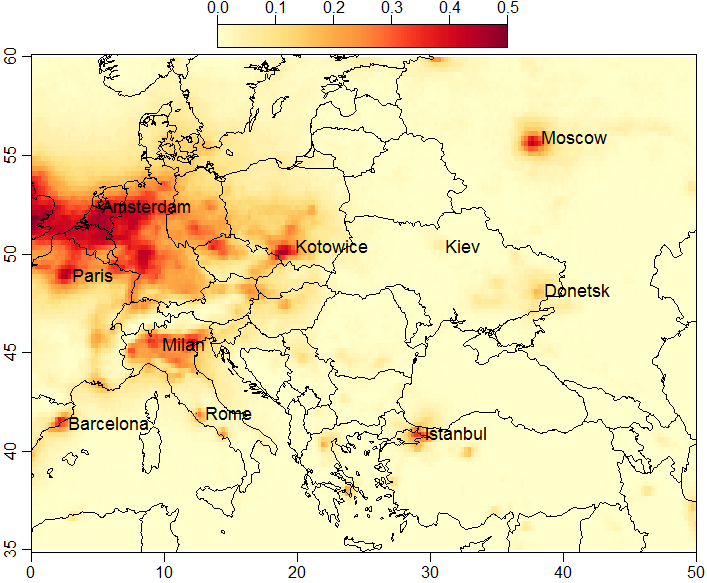
Air pollution risk map by Nitrogen Dioxide (NO2) with spatial resolution
~27,5 km × 18 km (0,25° × 0,25°). Aura OMI satellite data 01.10.2004—31.12.2012.
Open NO2 air pollution risk map in Google Earth
The map color scheme is selected to be good for grey-scale printing. If you would like to print the information from this post, please refer to a publication.
Method
The air pollution risk is defined as the probability of observing a pollutant concentration in a given interval over the territory under investigation. The risk is calculated for each grid cell. This risk calculation technique is simple yet delivers extensive understanding of typical air pollution character.
The risk of pollution for a grid cell equals to R(a, b) = S(a, b)/T, where S(a, b) is the number of days with nitrogen dioxide concentration in [a..b] interval (Dobson Units), and T is the number of days for which nitrogen dioxide measurements are not missing due to clouds or other reasons. Both S(a, b) and T are calculated for each grid cell.
This method, unlike previously proposed air pollution assessment techniques, takes into considerartion the whole available time interval, is resilient to outliers and tailored to building maps using Earth remote sensing data.
Pollution categories for NO2 are experimentally and subjectively defined as: 0.0..0.2 DU – low, 0.2..0.4 DU – moderate (open in Google Earth), 0.4..0.6 DU – high (open in Google Earth), 0.6..0.8 DU – very high, over 0.8 – disastrous.
Category intervals were selected to account for as many as possible NO2 pollution features (visually) and keep the number of categories acceptable.
To build the risk map, satellite air pollution data were used (Aura satellite, OMI instrument) during 01.10.2004—31.12.2012. Data are available daily and globally.
Publications
PDF ~477 KB
PDF ~600 KB
HTML-online


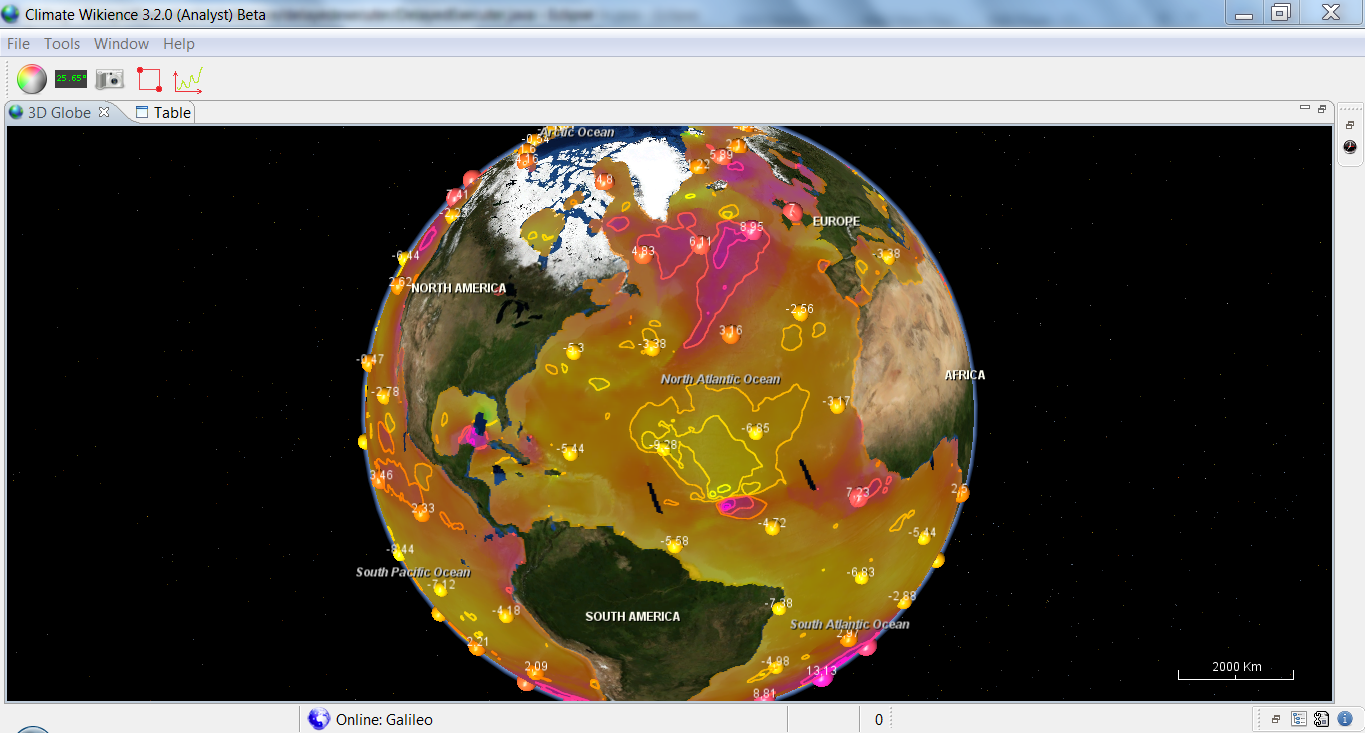
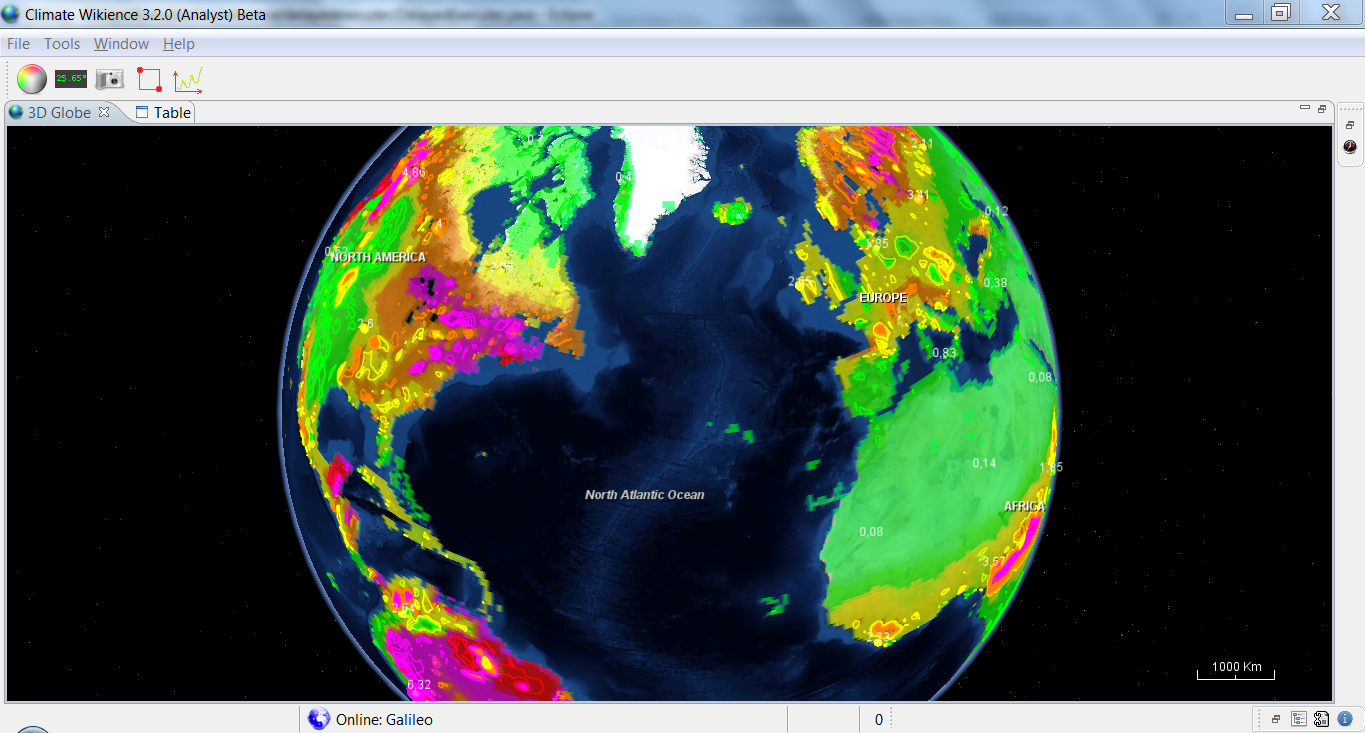
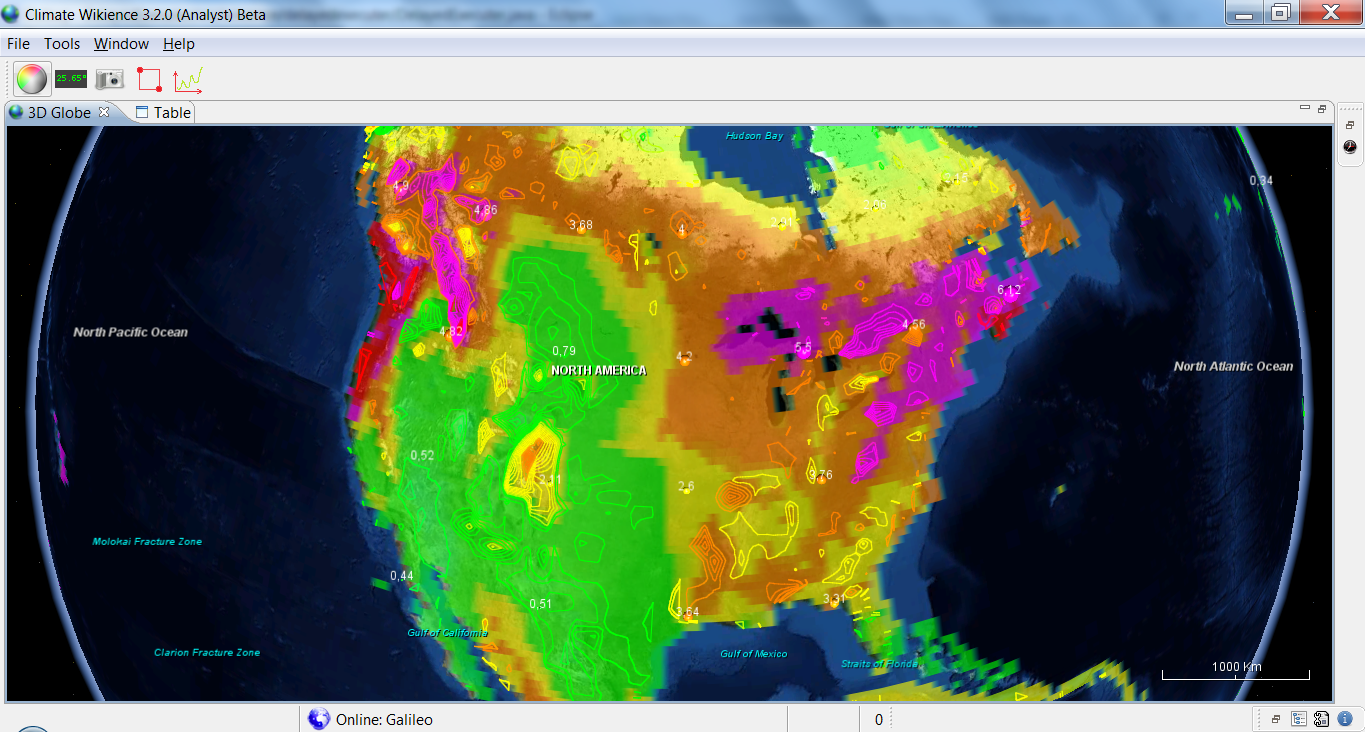
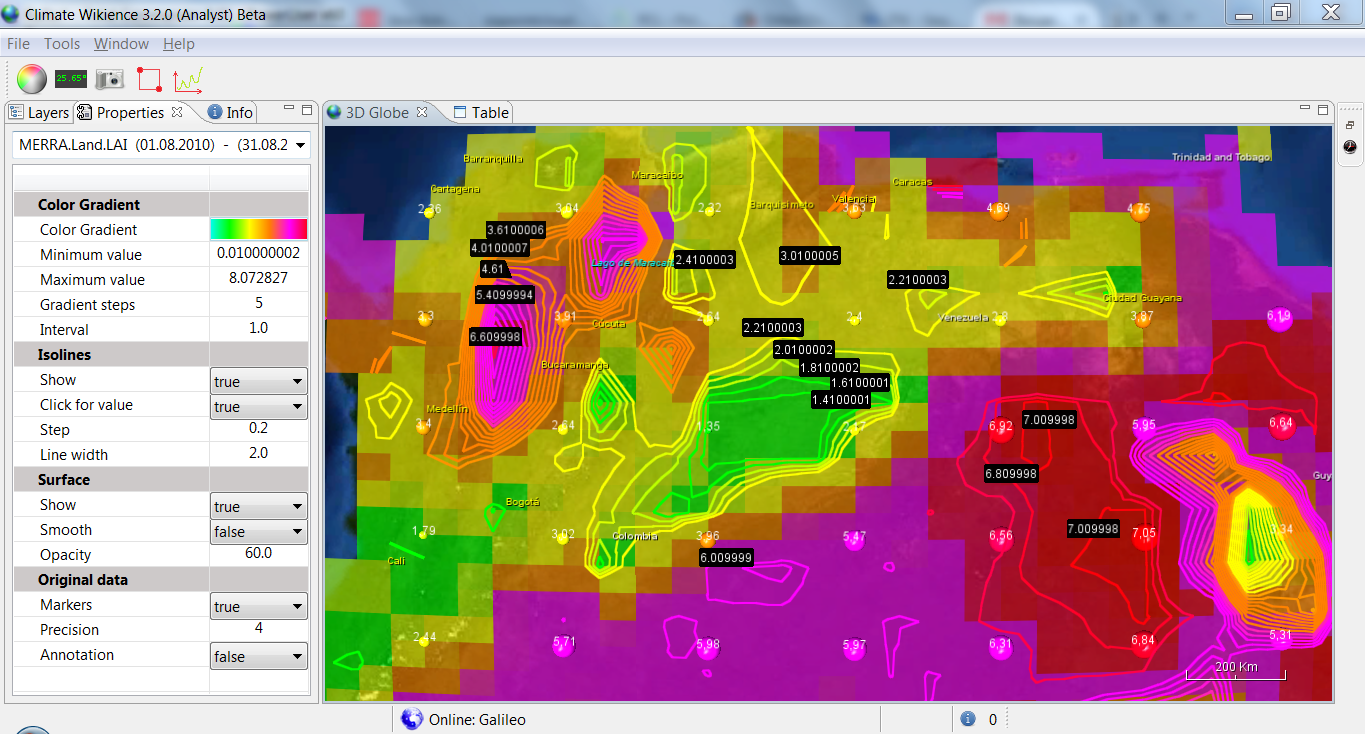
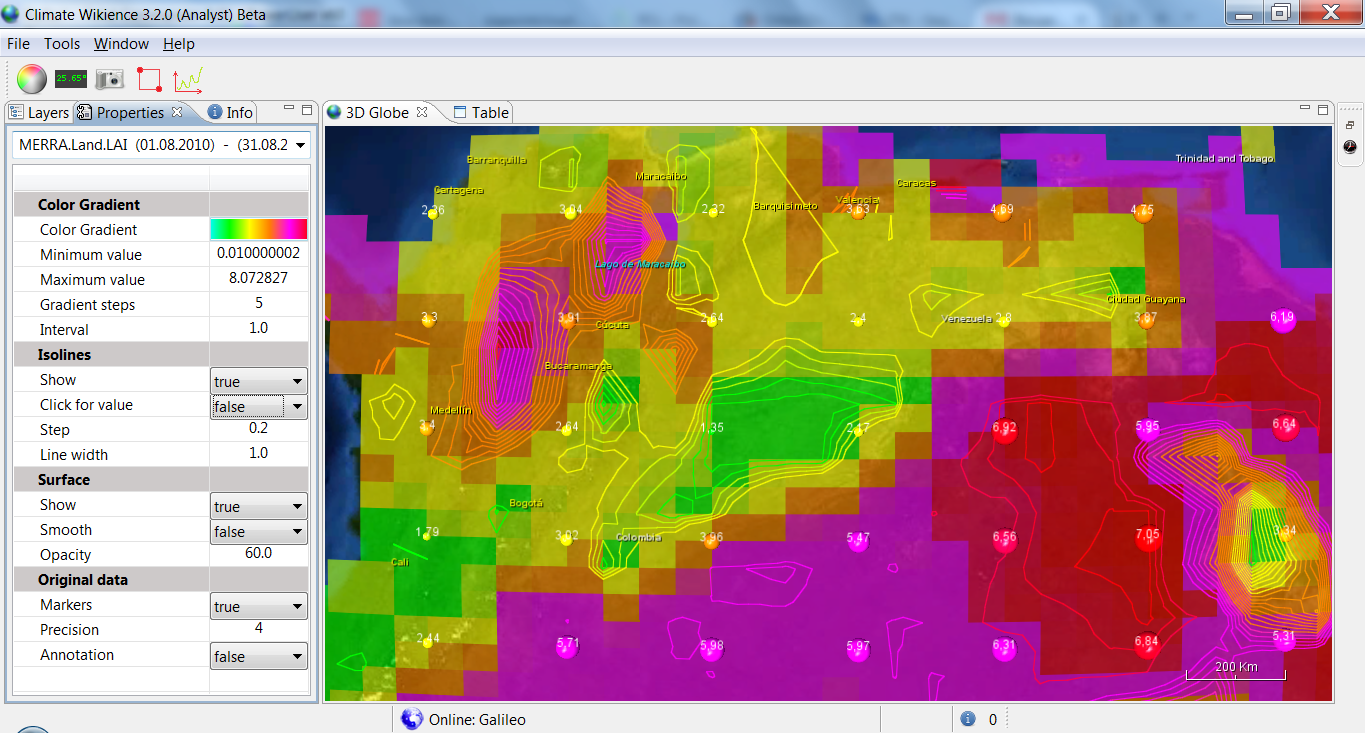
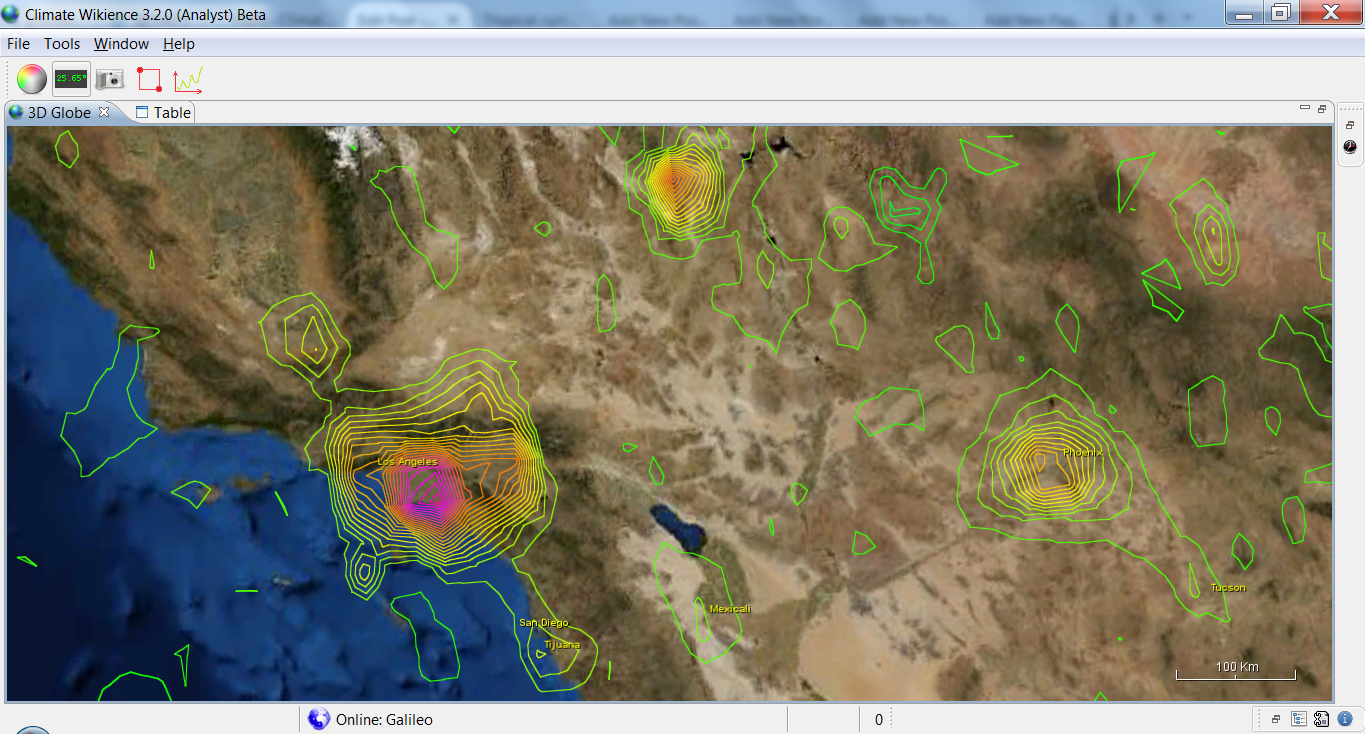
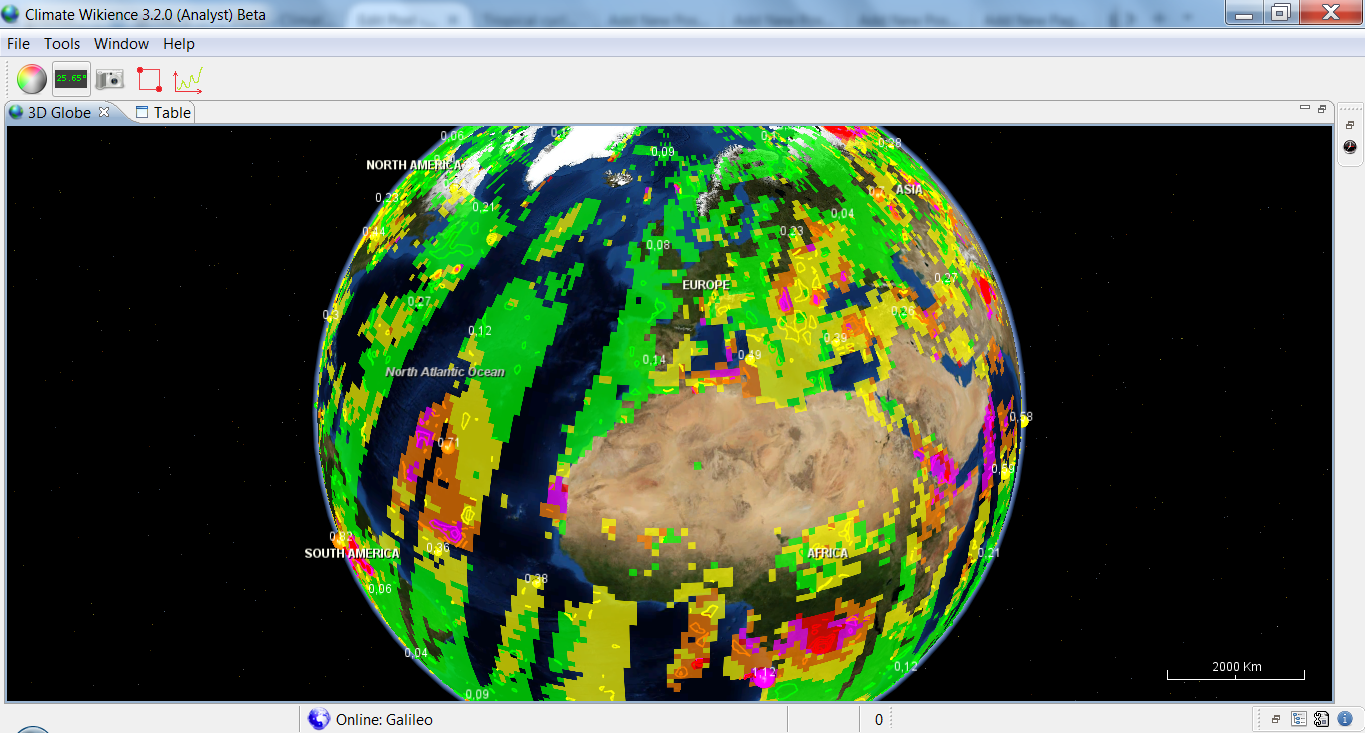
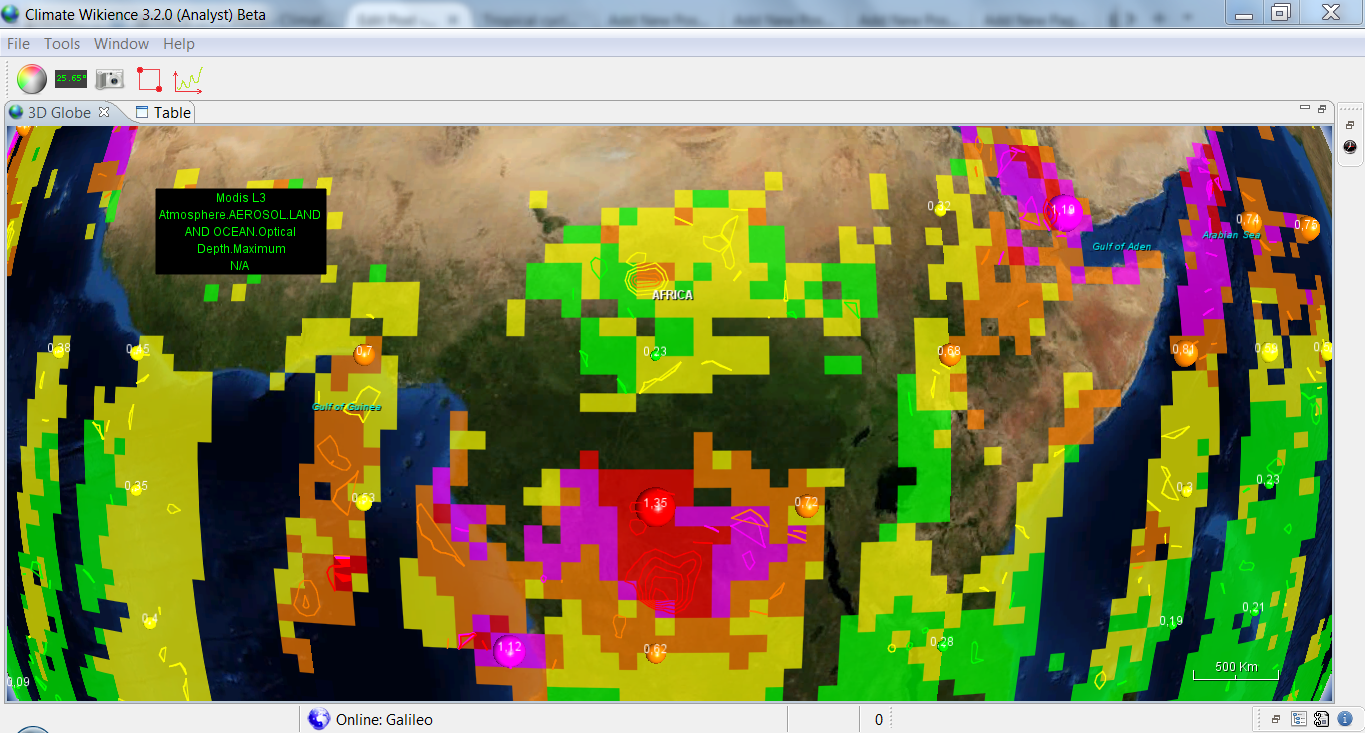
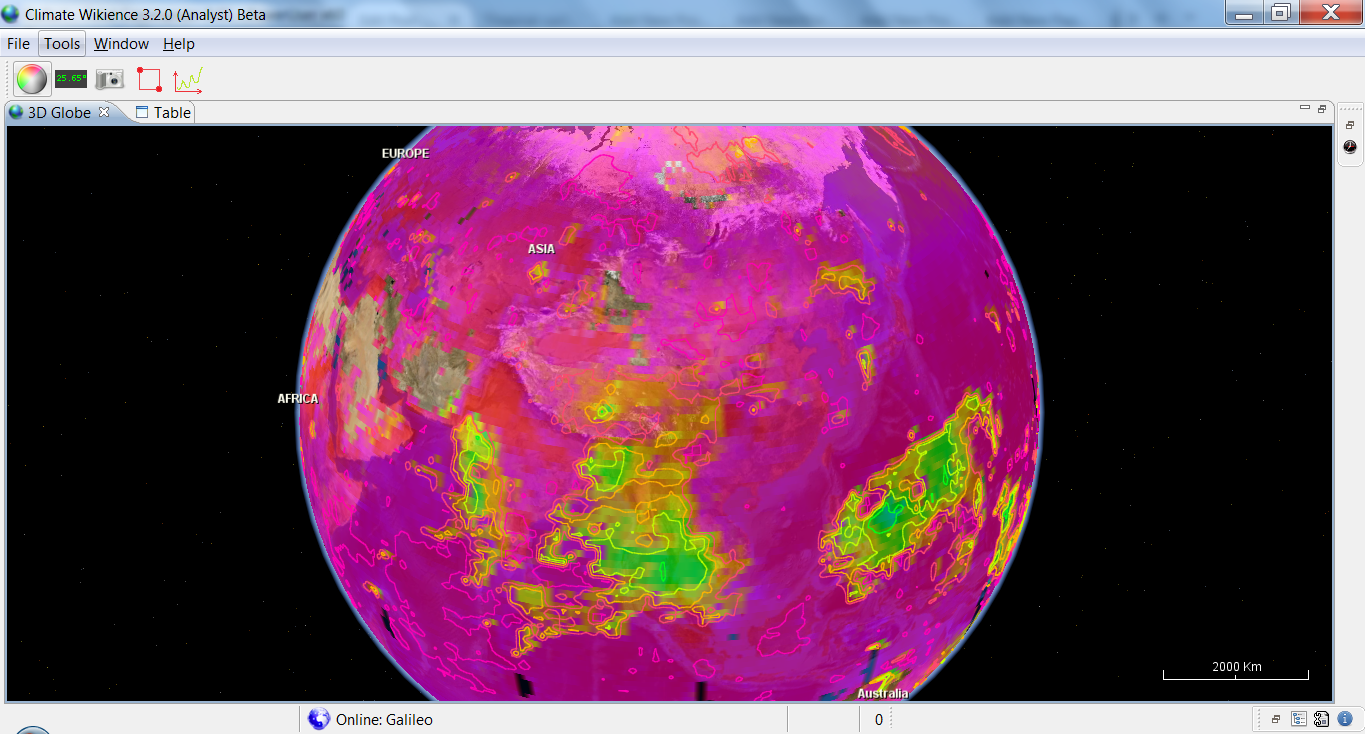
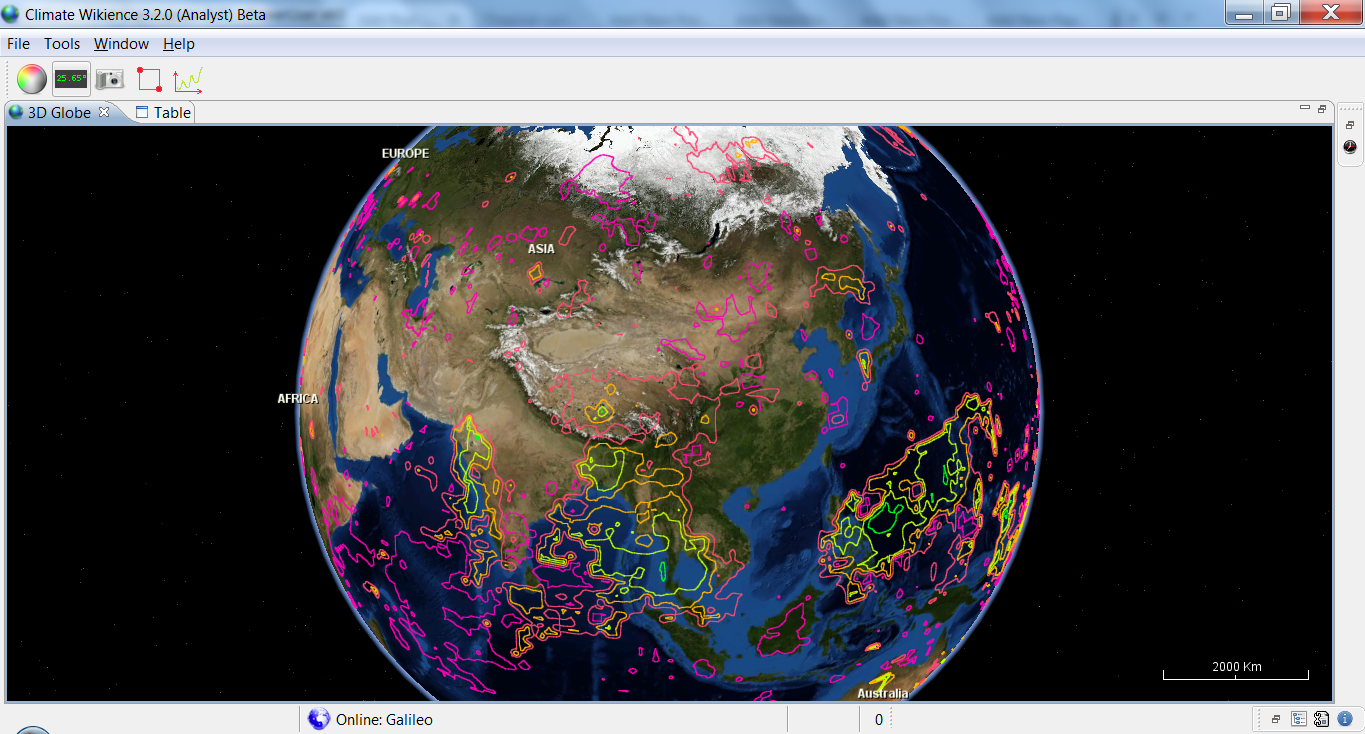
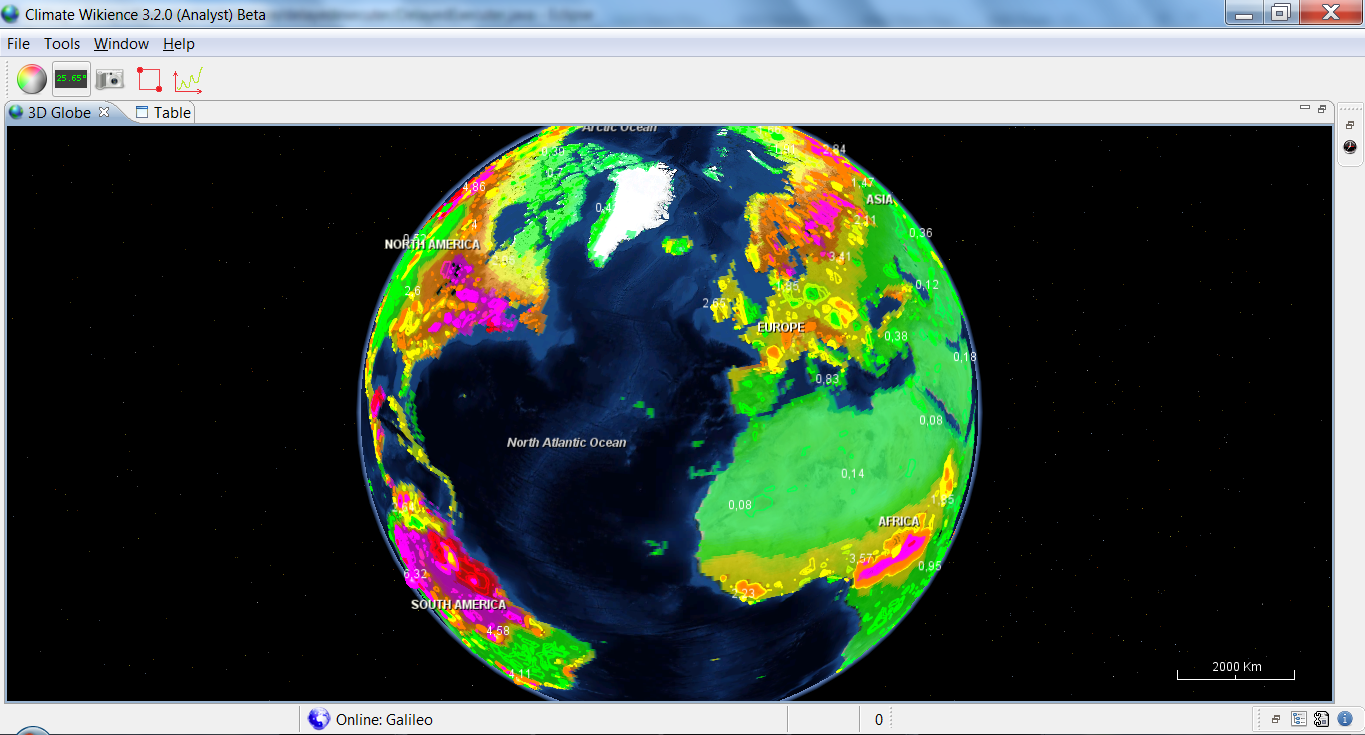
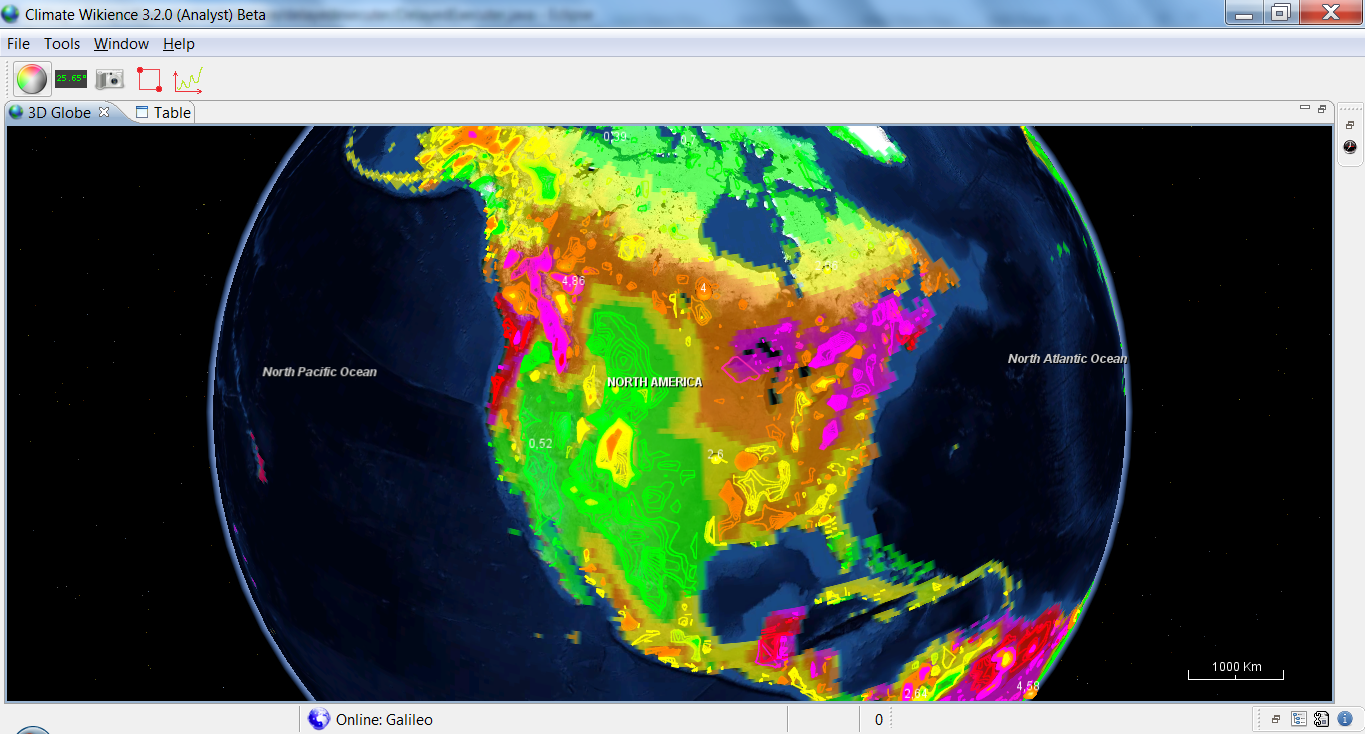
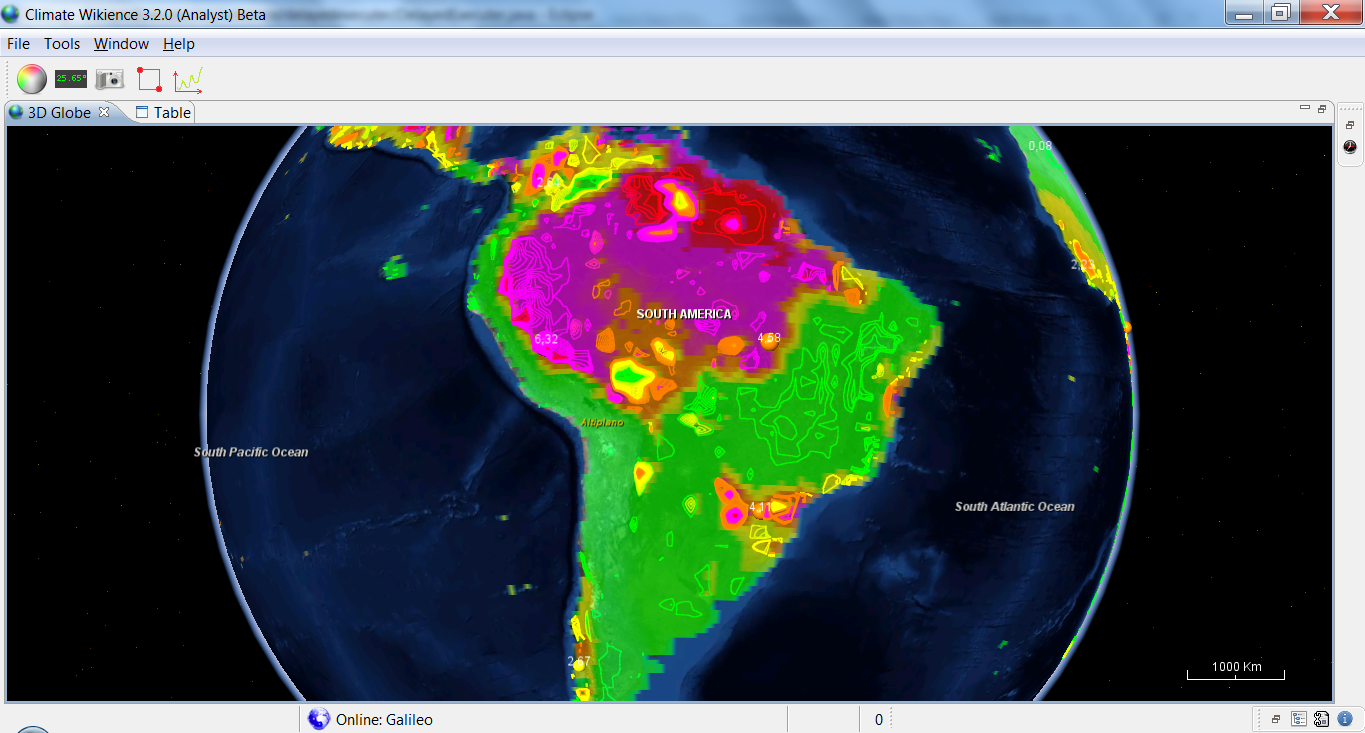
Isolines for satellite data
Below are examples of visualizing isolines for satellite data.
Click an image for its bigger version.
|
You can label any isoline at its arbitrary point. Simply enable “Click for value” option at the “Properties tab”. A label with isoline value will appear at the point where you clicked on the isoline. Click on the isoline again to hide the label.
|
|
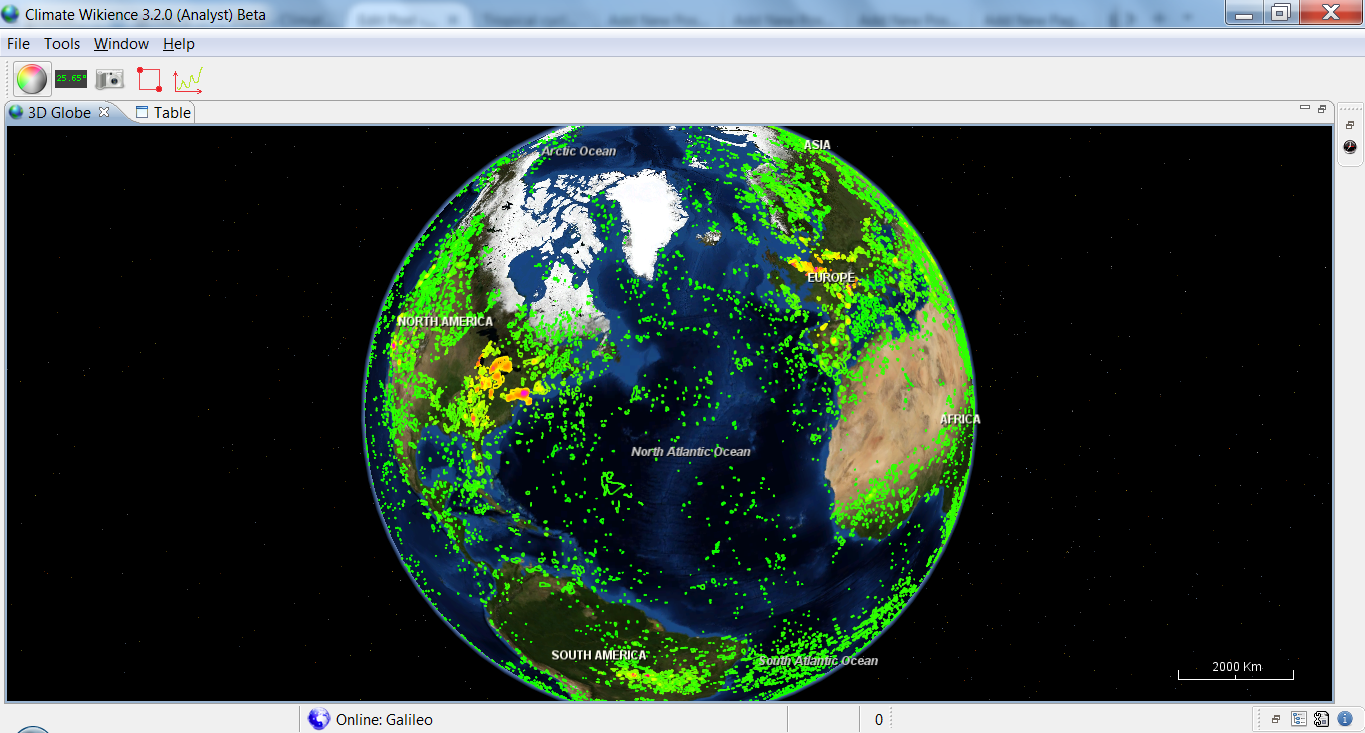
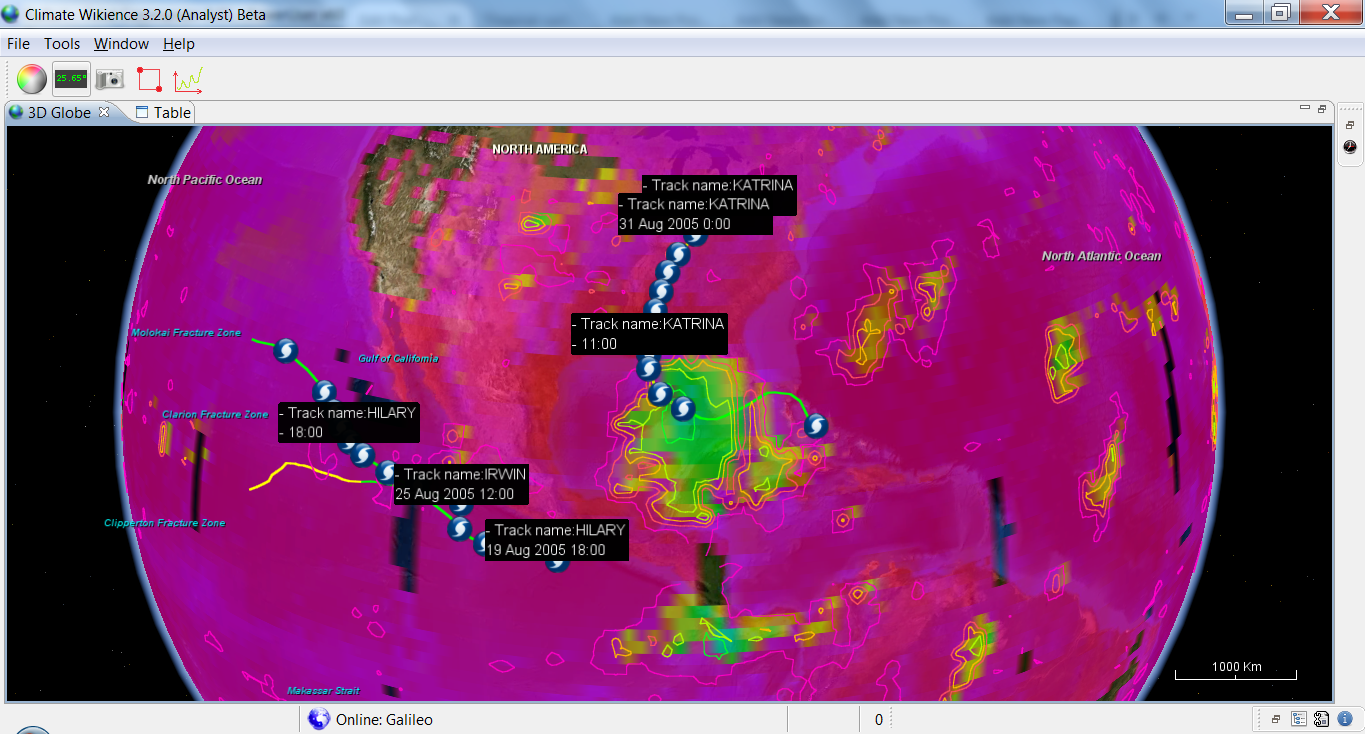
Climate Wikience is able to interactively visualize tropical cyclones. Find out more at Tropical cyclones page.
|
Download Climate Wikience
Archives
- February 2022 (1)
- May 2015 (1)
- April 2015 (1)
- February 2015 (8)
- January 2015 (4)
- November 2014 (5)
- October 2014 (4)
- May 2014 (4)
Tags
- Air pollution (1)
- Air pollution risk (1)
- AMSR-E (2)
- Aura Satellite (1)
- CFSR (3)
- Cloud top pressure (1)
- Cloud top temperature (1)
- Greeness fraction (1)
- Hurricane Katrina (5)
- IBTrACS (1)
- isolines (4)
- LAI (1)
- MERRA (1)
- MODIS (2)
- Nitrogen dioxide (2)
- OMI (2)
- QuikSCAT (2)
- RWikience (1)
- SSMIs (2)
- Time series (2)
- TMI (2)
- Wind speed (2)