Data
MERRA Total Precipitation
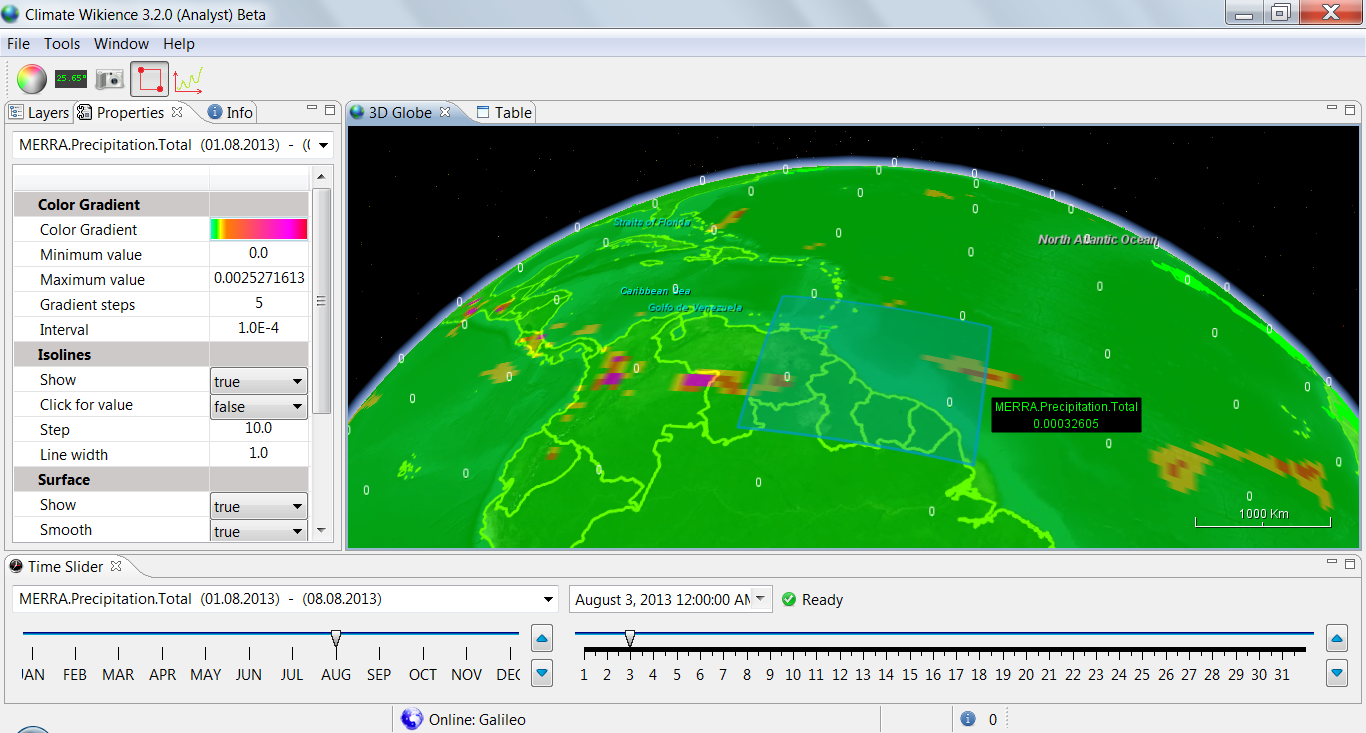
NASA MERRA Total Precipitation data are now available at Climate Wikience. Currently time series for the full time period since 01 Jan 1979 till 01 Jan 2015 with 1 hour time step are available for the northern part of South America as shown on the picture below (blue square).
Useful links


Wind swath (footprint) for tropical cyclones
Climate Wikience is able now to generate wind swath (footprint) for tropical cyclones. Find out more at Tropical cyclones page
Pacific Hurricane Iniki (1992) wind swath:
CFSR wind speed data
Climate Forecast System Reanalysis (CFSR) now available at Climate Wikience! The data are imported from NCDC NOAA
The temporal resolution of data is 1 hr while the spatial resolution is T382 Gaussian grid. Climate Wikience delivers regular latitude-longitude global grid with 0.25 deg x 0.25 deg resolution using bicubic interpolation.
CFSR does not direclty deliver wind speed, but eastward (u) and northward (v) wind speed vectors. The wind speed is calculated by Climate Wikience as square_root (u^2 + v^2).
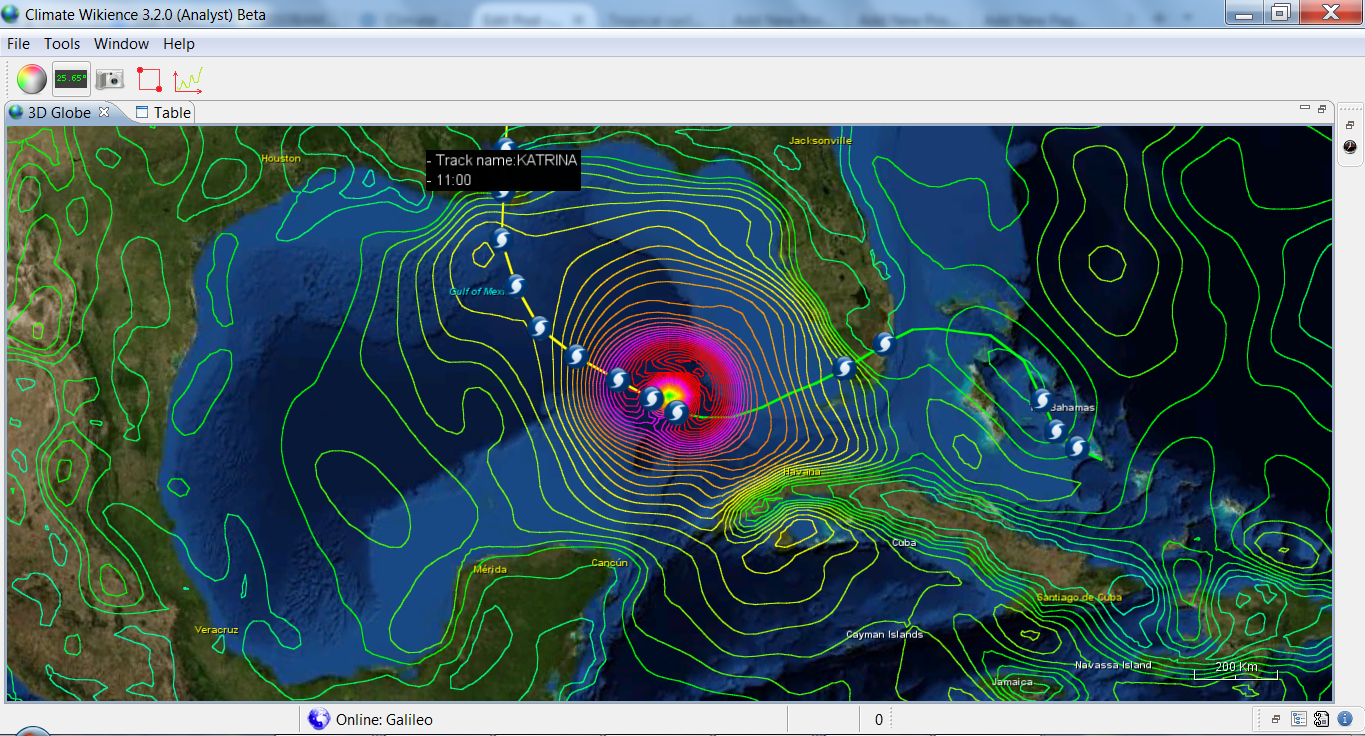
Below is the CFSR wind speed at 10 meters above surface on the 28th of August, 2005. The hurricane Katrina was near its peak strength on that date. The isolines are contoured every 1 m/s (meters per second).
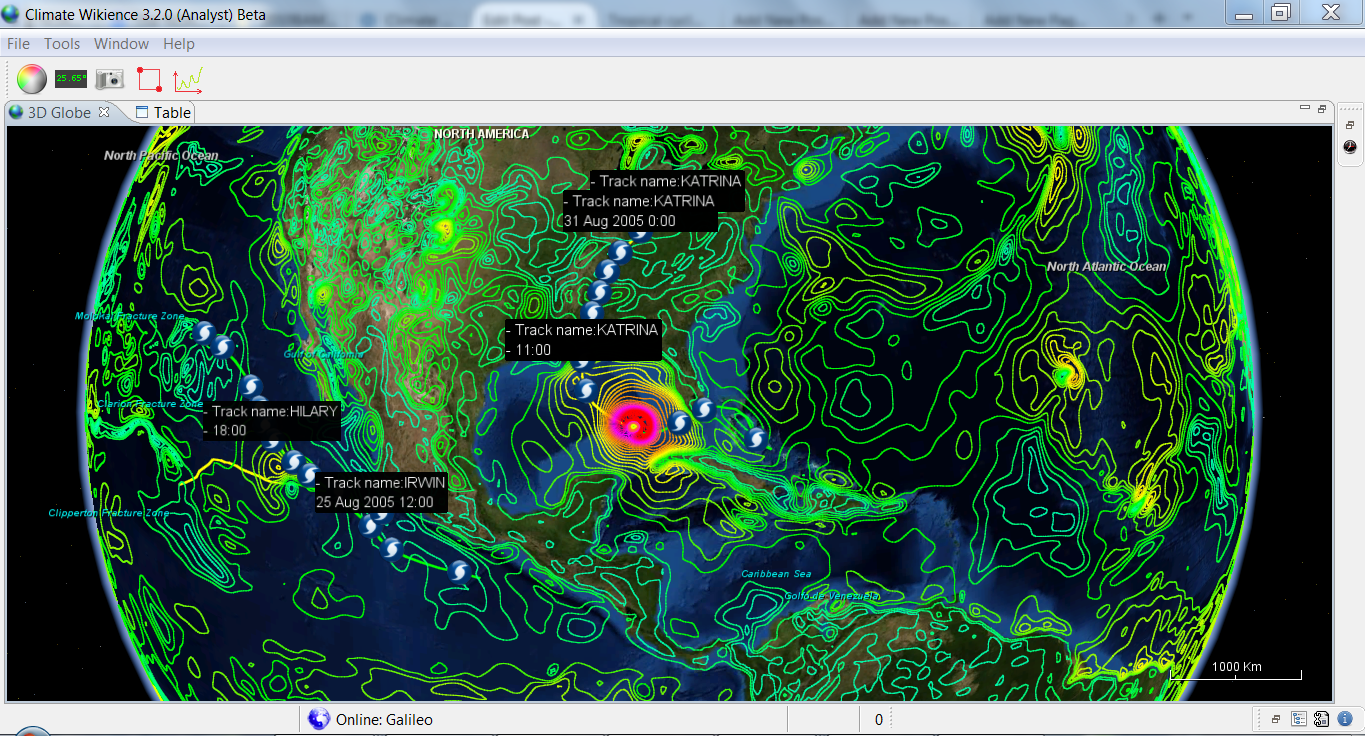
The zoom onto hurricane Katrina
Satellite data on sea wind
Blended sea wind data product from several satellites including QuikSCAT, SSMIs, TMI and AMSR-E. The product is gridded and has global coverage with 0.25 deg x 0.25 deg spatial resolution. The temporal resolution is 6 hours The data was imported from NOAA National Climatic Data Center
The product was derived from multiple satellite observations: DMSP SSMI F08, F10, F11, F13,F14 F15; TMI; QuikSCAT; AMSR-E while wind direction was taken from NCEP Reanalysis-2 (that is why the product is called “blended”).
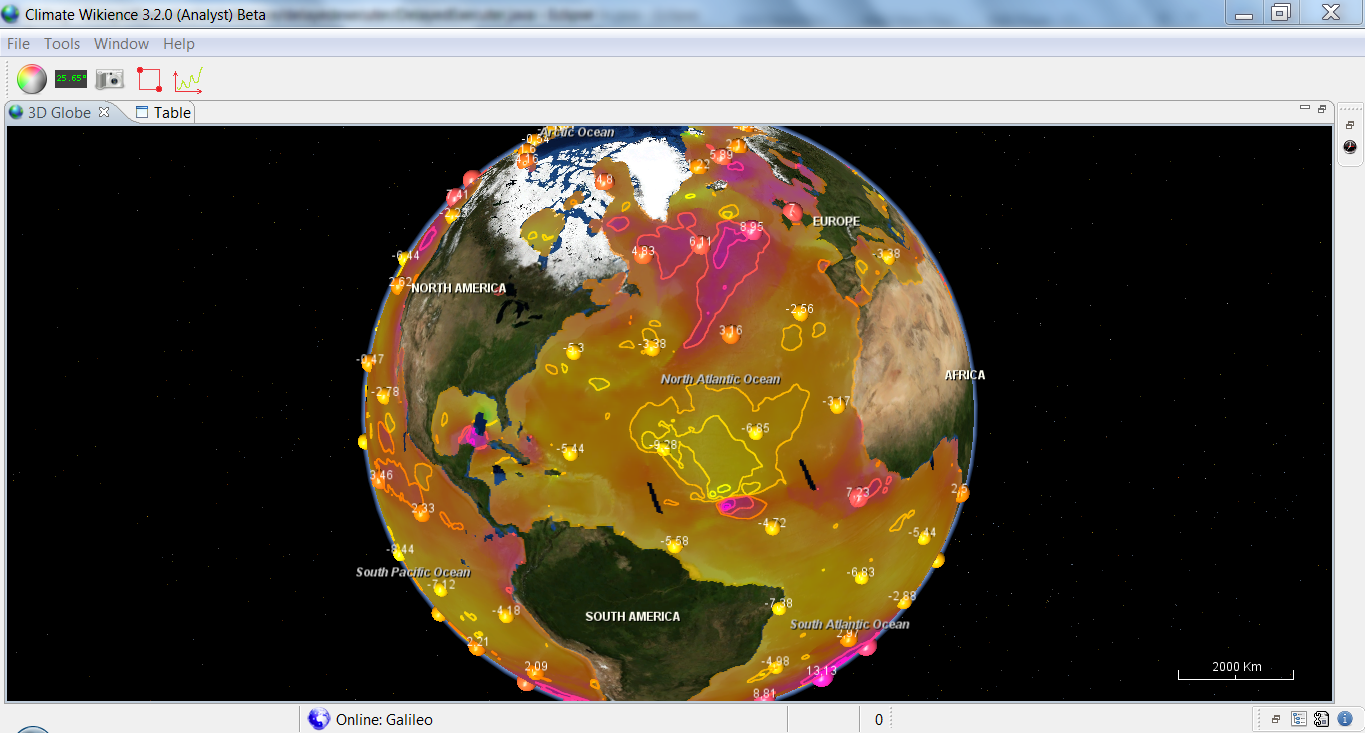
Below is eastward wind speed for 10 meters above sea surface (u10m) on the 28th of August, 2005.
The product was derived from multiple satellite observations: DMSP SSMI F08, F10, F11, F13,F14 F15; TMI; QuikSCAT; AMSR-E while wind direction was taken from NCEP Reanalysis-2 (that is why the product is called “blended”).
Below is eastward wind speed for 10 meters above sea surface (u10m) on the 28th of August, 2005.
Please, visit the Earth remote sensing data page for details.
Tropical cyclones 1848 – 2014 active and online!
Climate Wikience now provides best tracks for all tropical cyclones since 1848 up to 2014. The data were imported from “IBTrACS – best tropical cyclone tracks”
Climate Wikience enables you not only to view tracks on the globe but also visualize related data like wind speed or cloud top temperature.
Hurricane Katrina near its peak strength and Terra MODIS Cloud Top Temperature. The 25th of August, 2005. (click the image for bigger version)
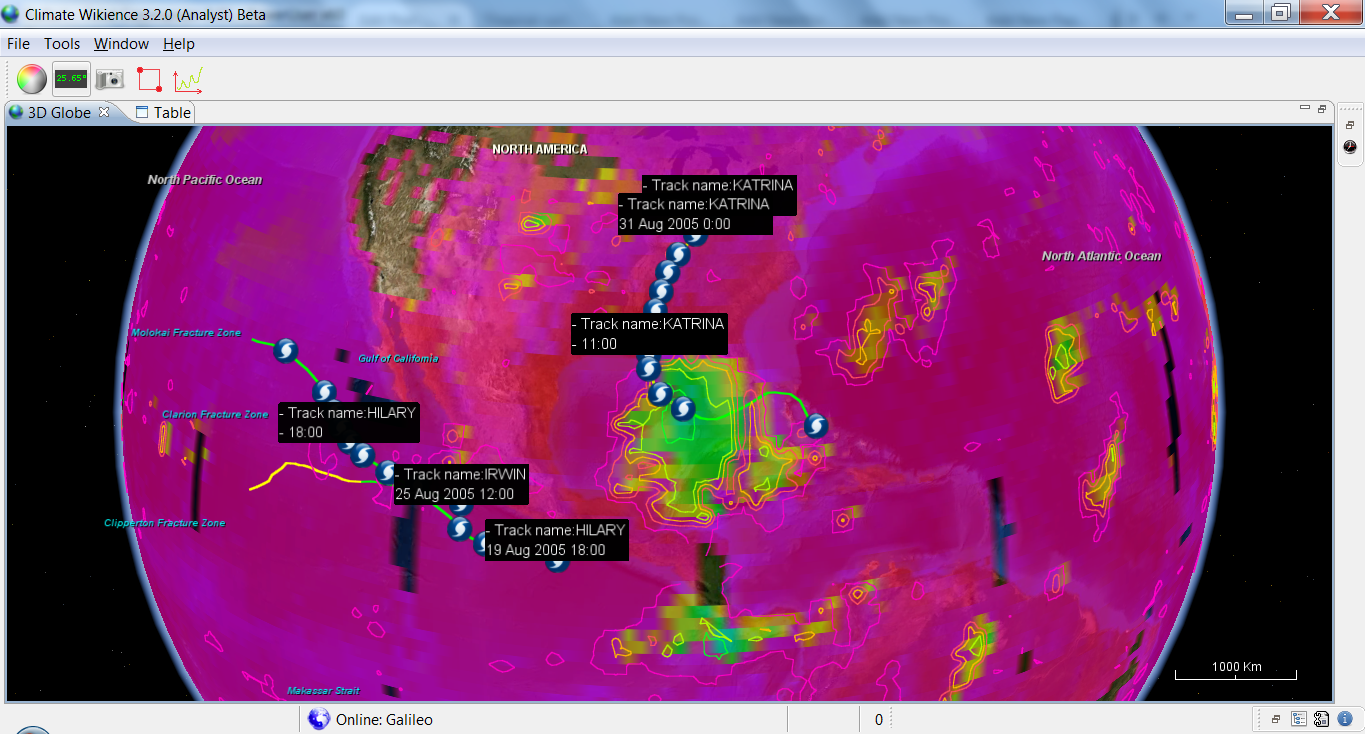
The track display is interactive. You can change the time for which related data are visulized simply by double-clicking on cyclone center. Climate Wikience will automatically change the time and loads the data.
Each cyclone center has associated data like latitude/longitude coordinates, the date and time and many other properties. You can visualize the associated data near cyclone center by adjusting the “Properties” tab.
Find out more at Tropical cyclones page
Archives
- February 2022 (1)
- May 2015 (1)
- April 2015 (1)
- February 2015 (8)
- January 2015 (4)
- November 2014 (5)
- October 2014 (4)
- May 2014 (4)
Tags
- Air pollution (1)
- Air pollution risk (1)
- AMSR-E (2)
- Aura Satellite (1)
- CFSR (3)
- Cloud top pressure (1)
- Cloud top temperature (1)
- Greeness fraction (1)
- Hurricane Katrina (5)
- IBTrACS (1)
- isolines (4)
- LAI (1)
- MERRA (1)
- MODIS (2)
- Nitrogen dioxide (2)
- OMI (2)
- QuikSCAT (2)
- RWikience (1)
- SSMIs (2)
- Time series (2)
- TMI (2)
- Wind speed (2)