To retrieve time series in Climate Wikience, three steps should be taken to specify three necessary parameters:
- Dataset (select in Layers/Temporal tab)
- Geographical region on 3D globe (use “Region selector” tool)
- Required time interval for which you would like the time series to be retrieved
Let’s cover these steps in detail.
1. Select dataset
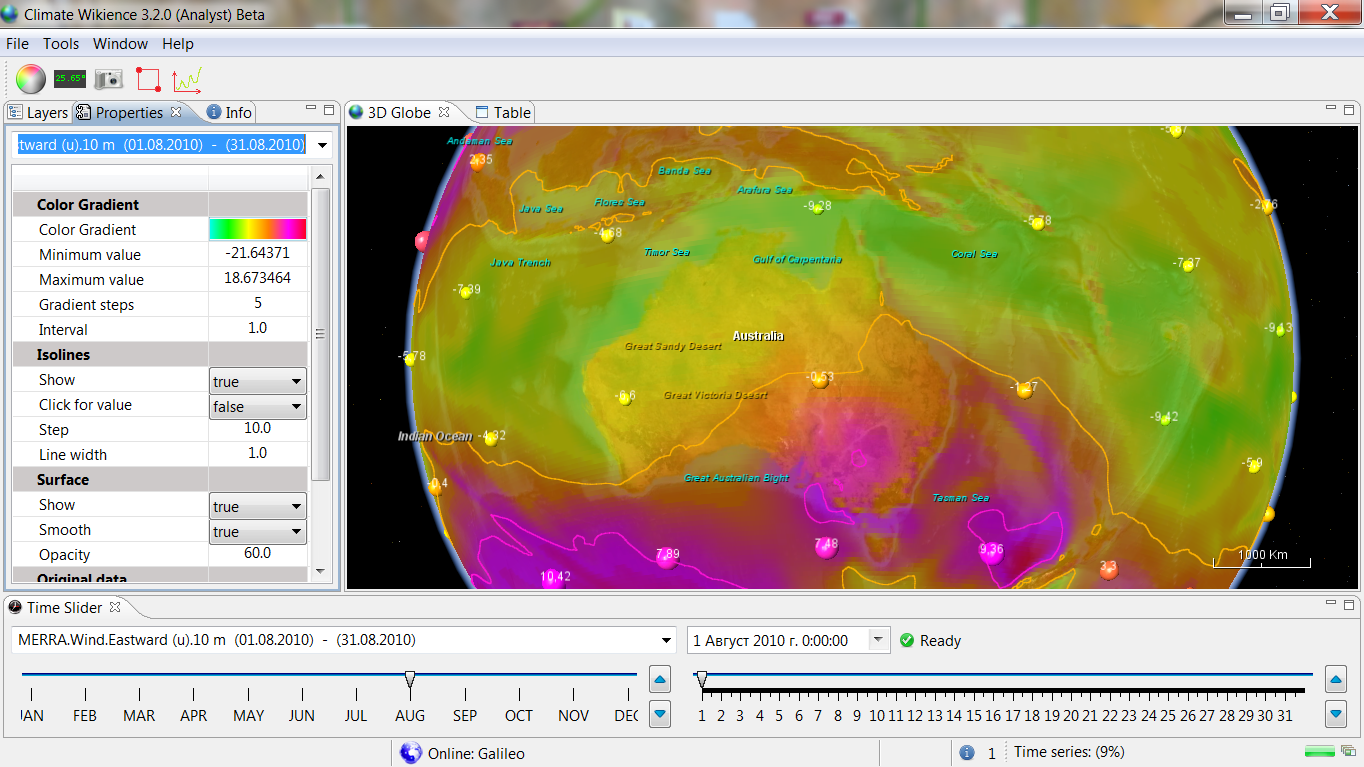
Climate Wikience will retrieve time series for the current dataset. The current dataset is the dataset which properties are currently displayed on “Properties” tab. The name of the current dataset is also displayed on “Time slider” dropdown list:
 [1]
[1]
You can make a dataset current in several ways:
• Find the dataset in tree view on “Layers/Temporal” tab and turn it on by checking the box left to the dataset name
• Select the dataset from dropdown list in “Properties” tab or “Time slider” if you have already turned it on some time earlier during your work with Climate Wikience
2. Select region
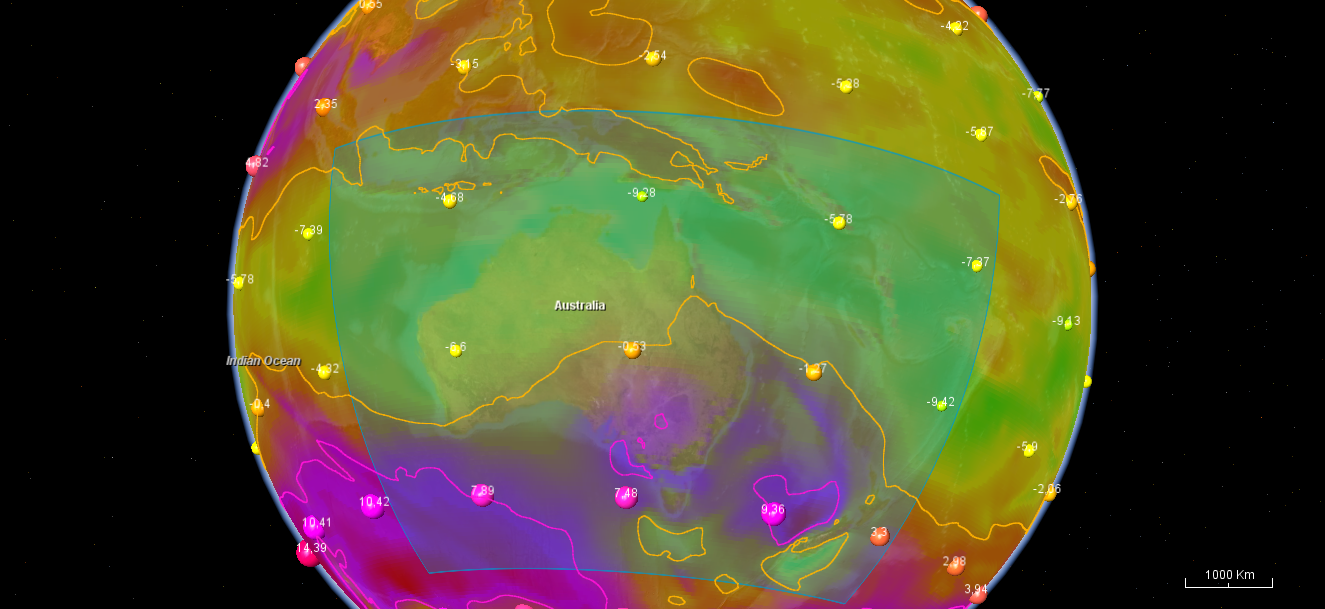
Press button ![]() “Select region” located on the toolbar. Climate Wikience will automatically “fly to” the geographical region for which time series are available. Use mouse to select the region. The available region on the 3D Globe will be colored blue.
“Select region” located on the toolbar. Climate Wikience will automatically “fly to” the geographical region for which time series are available. Use mouse to select the region. The available region on the 3D Globe will be colored blue.
 [2]
[2]
2.1 Limitations on region size
Since there are thousands of grid points for which time series can be obtained, there is a limitation on the size of geographical region that can be selected (for which time series could be requested).
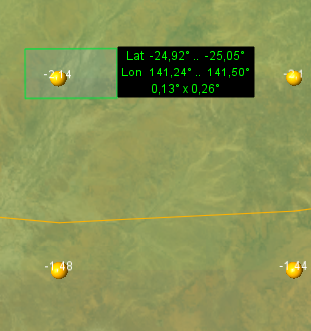
Each dataset has it own limitation on selected region size. To view the region size during selection and to keep the size in the allowed limits, turn on ![]() “Show cursor position” tool. When the region selection is disabled, this tool shows mouse cursor position (latitude and longitude). When the region selection is enabled, it shows the following region paramters near to mouse cursor:
“Show cursor position” tool. When the region selection is disabled, this tool shows mouse cursor position (latitude and longitude). When the region selection is enabled, it shows the following region paramters near to mouse cursor:
• southern and northern latitude
• eastern and western longitudes
• region size (latitude degrees x longitude degrees)
|
|
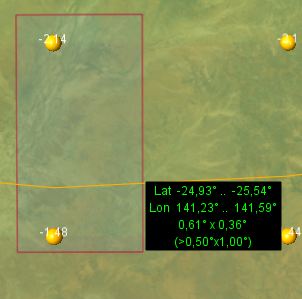
When you are dragging mouse cursor and the size of the selected region is less than the maximum allowed for the current dataset, the region is colored green. When the region becomes oversized, it is colored red and additionally to region characteristics the size of the maximum allowed region appears:
In this case, the size of the maximum allowed region is 0.5°x1.0°. You can still select the region that is larger than the maximum allowed, however it will be automatically trimmed (shown below at time series request dialog).
2.2 Trimming of the selected region
Once you finished selecting the region, press ![]() on the toolbar. Time series request dialog will appear.
on the toolbar. Time series request dialog will appear.
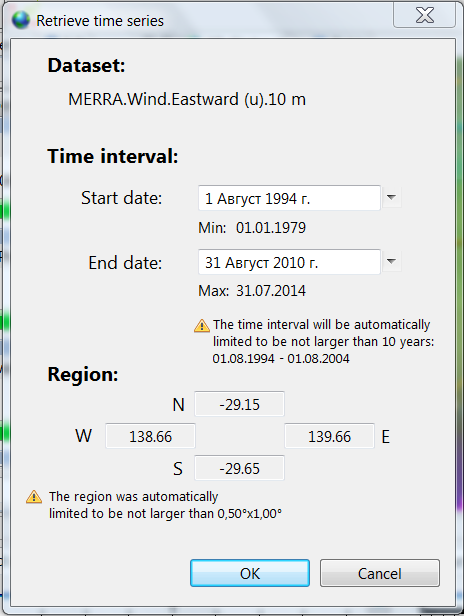
This dialog summarises the request by showing the selected dataset name, time interval and geographical region.
If you selected the region larger than maximum allowed, the corresponding notification will appear with warning icon ![]() . The oversized region will be automatically reduced to fit into the maximum allowed boundaries. The northern latitude and western longitude will remain the same (as you selected) while the southern latitude and eastern longitude of the region border will be changed.
. The oversized region will be automatically reduced to fit into the maximum allowed boundaries. The northern latitude and western longitude will remain the same (as you selected) while the southern latitude and eastern longitude of the region border will be changed.
In the dialog shown above, the difference between latitudes does not exceed 0.5° and between longitudes does not exceed 1°. The southern latitude was calculated by subtracting 0.5° from the value of nothern latitude. The eastern longitude was calculated by adding 1° to the western longitude.
3. Select time interval
The time series dialog allows to specify the time interval for which time series should be retrieved. There are two important notices about selecting time interval.
3.1 Available time interval
The available time interval for time series (shown at time series request dialog) may differ from the available time interval for gridded global dataset (shown on time slider)
For example, NASA MERRA wind speed gridded data are available globally currently only for August 2010, but time series for this dataset are available for Australia since 01 January till 31 July 2014 (35.5 years).
3.2 Limitations on the selected time interval length
Each dataset has limitation on the time interval length that could be requested per single query.
Select start and end date for time interval for which you would like to retrieve time series. If the selected time interval will exceed the maximum allowed length for current dataset, corresponding notification will appear. This notification will contain the maximum allowed time interval length and the reduced time interval for which time series will be requested.
In the reduced time interval, the starting date will be the same as you selected while the end date will be set to the earlier date than you selected to keep the interval length within maximum allowed. For example, if the maximum allowed time interval is 10 years, the end date is calculated as start date + 10 years.
The limit on time interval is introduced since there are datasets with hourly time steps and long available time periods. For example, NASA MERRA wind speed and direction data are avaialbe for 35.5 years with hourly time step. This is approximately 311000 values for a single grid point.
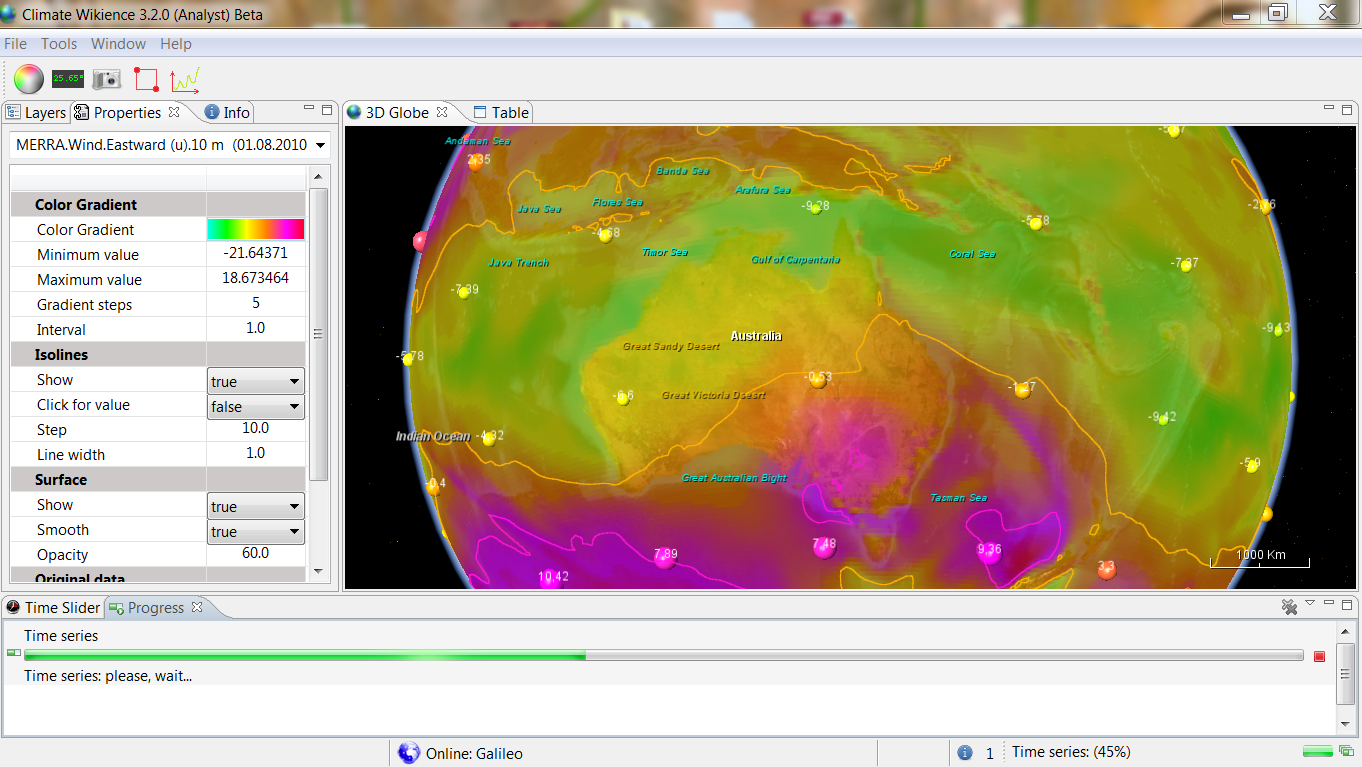
Results
When you selected all parameters, press the OK button on time series request dialog. Climate Wikience will send your request to server. Please, wait while the server will extract the data. Once Climate Wikience receives the data, it prepares the interface to display the result. If the resulting time series has thousands of values, the process may take some time to complete, so you will be notified by the progress bar.
 [3]
[3]
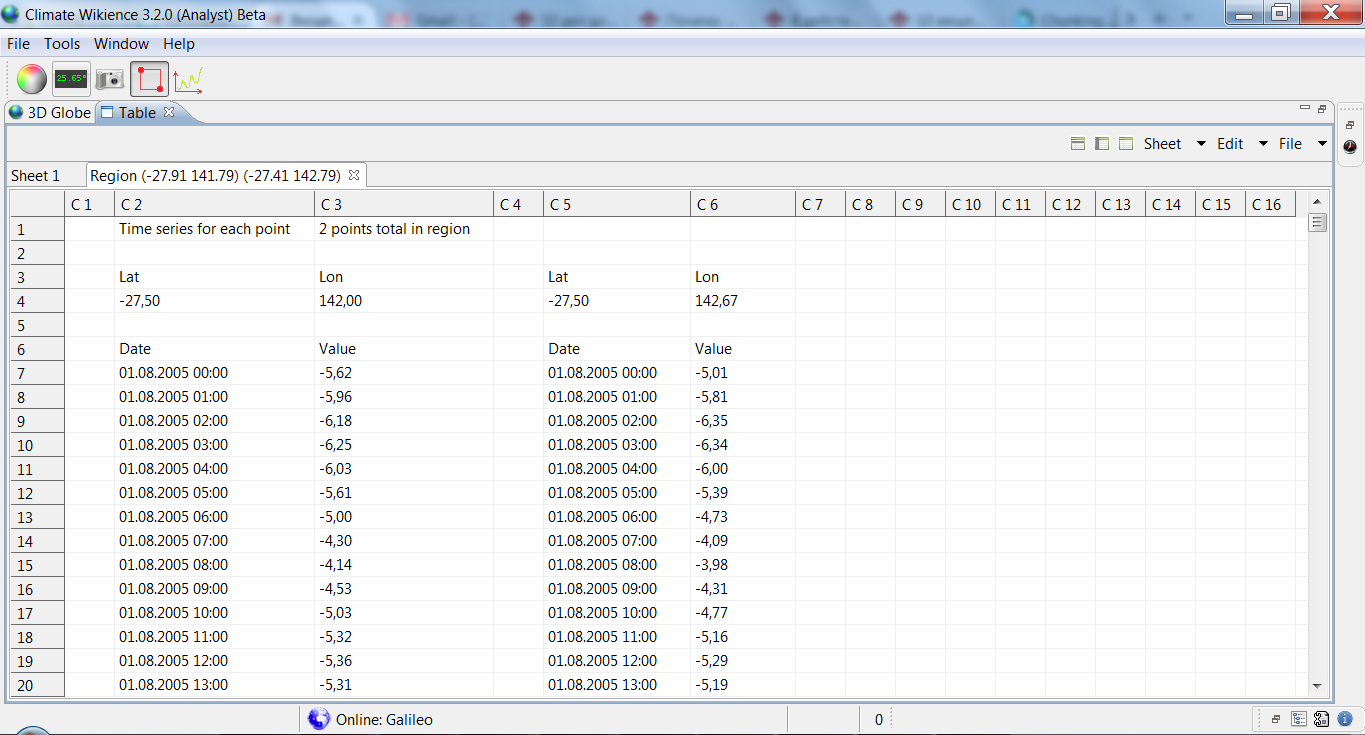
Time series are visualized by data table.
 [4]
[4]
The format of the time series in data table is as follows. The tab name of the data table contains the cordinates of the selected region. In case if region was reduced, the coordinates of the reduced region are shown. At the top of the data table sheet, there is the number of points covered by the region (maybe reduced).
For each grid point of the region, its coordinates are shown (Lat and Lon). Other rows of the data table sheet show the dates and the values of the time series for a grid point (one row per one date).
If you would like to select time series for different time interval but for the same region (since there is a limitation on the maximum time interval length per single query), do not select region again. Instead, call the time series request dialog by clicking ![]() on the toolbar. The dialog will contain both the old region and the old time interval you used for your previous query. Adjust time interval as you need and press OK button. Climate Wikience will retrieve time series for the same region as previous query but for updated time interval.
on the toolbar. The dialog will contain both the old region and the old time interval you used for your previous query. Adjust time interval as you need and press OK button. Climate Wikience will retrieve time series for the same region as previous query but for updated time interval.
If you would like to save the resulting time series as CSV or Excel file, use corresponding buttons at the top right corner of the data table.


